Big Data Analytics in Construction: From Project Chaos to Precision Control
Last updated: April 2026
Construction ranks among America's most dangerous jobs. More than 1,000 workers lost their lives in 2022 alone. Big data analytics in the construction industry now offers a powerful solution to this sobering reality and other challenges that plague the sector.
Construction projects come with countless moving parts - labor, materials, timelines, and regulations. Project management without advanced tools often results in inefficiency, accidents, and financial losses. Data analytics gives construction teams clear, evidence-based guidance in this high-stakes field. To cite an instance, predictive analytics helps reduce risk while making your decision-making process better. McKinsey & Company suggests that solutions using predictive analytics will reshape the scene of how construction firms bid on and execute projects.
The market demands technological adaptation, with 72% of industry professionals believing new technology and software are crucial to stay competitive. Big data helps construction teams predict risks, avoid hazardous conditions, and track vital safety equipment maintenance. Teams that use construction data analytics see better operations, lower costs, smarter decisions, and higher profits. This piece shows how big data construction management turns chaotic projects into precisely controlled operations that save money, time, and most importantly, lives.

What is Big Data Analytics in Construction?
Construction projects create massive amounts of data. This data comes from equipment sensors, time logs, digital plans, and RFIs. Big data in construction means these very large datasets that regular software can't process well. The biggest problem isn't collecting this information but turning it into something useful for your business.
Defining big data in the construction industry
The construction sector creates 2.5 quintillion bytes of data daily. Companies don't use 95.5% of this valuable information. Big data in construction covers everything collected at your jobsites. This includes machinery performance metrics, environmental conditions, worker productivity figures, digital plans, and financial records.
Your construction company probably collects information from several sources:
- Building Information Modeling (BIM) systems
- IoT sensors on equipment and wearables
- Project management platforms
- Time tracking systems
- Financial records
Raw construction data won't help you make better decisions by itself. The real value comes from turning this information into practical insights. Construction companies are using more data-focused methods now. Cloud-based platforms, AI-powered analytics, and automation tools give immediate visibility into all parts of your projects.
How data becomes insight: from raw logs to decisions
Big data must become either business intelligence or business analytics to be useful. Think of raw data as building materials that need shaping into a finished structure before they provide value.
Business intelligence helps create a clear picture of your company's current state. Leadership teams usually do this analysis by hand to learn about areas like operational efficiency or customer satisfaction. Business analytics come from specialized software and focus on numbers. These help you understand why specific things are happening.
The path from raw data to decision-making follows clear steps. Companies first collect information from many sources like BIM models, IoT devices, and safety monitoring systems. This data then moves to centralized, cloud-based platforms where teams can analyze it together. Finally, analytical tools help find patterns across projects and spot hidden inefficiencies.
Good data analytics needs a strong construction platform and skilled analysts who can turn raw information into useful formats. The main goal is to find meaningful insights - the practical findings your team can use.
Construction managers and executives spend about 11.5 hours each week studying and analyzing data. BIM/VDC and preconstruction roles spend even more time - 12.3 and 13.4 hours weekly. In spite of that, research shows a gap between collecting and using data. While 86% of construction firms collect financial data, only 33% analyze and use it to make decisions.
Companies that close this gap see great results. FMI's research shows that "data leaders" can expect a 50% increase in average profit growth rates yearly compared to beginners. A business making $25 million in annual profits could see around $700,000 more in profits.
Using big data also helps companies make 69% better strategic decisions. In this piece, we'll show how your construction company can join these data leaders and turn project chaos into precision control.
Types of Construction Data Analytics Explained
Construction firms have mountains of data but struggle to make sense of it. The four types of data analytics can reshape how you manage projects. You'll move from basic record-keeping to accurate predictions of what comes next.
Descriptive analytics: what happened
Descriptive analytics looks at past project data to show how things went. Think of it as your project's rearview mirror that shows where you've been. This simple analysis sums up jobsite events through stats and visual data.
Construction projects use descriptive analytics to spot patterns in how teams use equipment, materials, and labor. You might track material usage to spot where you're ordering too much concrete. This simple compliance data shows you what's happening now, so project leaders can spot trouble areas quickly.
Descriptive analytics answers "What happened?" questions. When a structural part fails, the data shows exactly what events led to the failure. Project managers also use this method to track safety compliance and meet regulations.
Diagnostic analytics: why it happened
After you know what happened, diagnostic analytics helps explain why. This method digs deep to find the real reasons behind events or problems on your construction sites.
Here's a real example: diagnostic analytics can show why a wall fell down by looking at material damage, bad fasteners, or wrong assembly steps. This helps you find the actual problem instead of just seeing the symptoms.
Diagnostic analytics proves most useful when you need to know why projects run late, cost too much, or have safety issues. Data gives you the exact factors that led to these outcomes. This creates a solid base to make targeted fixes instead of random guesses.
Predictive analytics: what might happen
Predictive analytics marks a big step forward for construction firms. It uses current and past data with statistical models and machine learning to see what's coming next.
Construction teams get practical benefits in several areas:
- Project delay forecasts based on weather, resources, and past results
- Equipment breakdown predictions
- More accurate project bids using past price data
- Early warning signs for safety risks
McKinsey & Company says predictive analytics and machine learning will change how engineering and construction firms bid and build projects. One company that used predictive analytics saw 20% better quality and safety on site, while teams spent 25% more time fixing high-risk issues.
Prescriptive analytics: what should be done
Prescriptive analytics sits at the top of data maturity. It goes beyond predictions to tell you exactly what to do. This advanced method uses math optimization, simulations, and decision analysis to find the best solution in tough situations.
Prescriptive analytics shines because it tells you what to do next. If models show a wall might fall under pressure, prescriptive analytics lists specific ways to reinforce it. It can also pick the right safety gear based on known risks.
You need three things to use prescriptive analytics:
- Math optimization to find the best solutions within limits
- Simulations that show how complex systems work in different scenarios
- Decision analysis to weigh different options
Construction firms can move from fixing problems to preventing them with prescriptive analytics. Instead of putting out fires, you can spot issues and fix them before they hurt your timeline or budget.
How Real-Time Data Improves Construction Decisions
The gap between gathering information and taking action can make or break construction projects. Up-to-the-minute data analysis helps you move from reactive to proactive decision-making. You can solve problems before they turn into expensive delays.
Live tracking of project progress and delays
Weekly reports to find schedule slippage are now outdated. Live progress tracking shows you exactly how your project unfolds compared to the original plan. Construction management systems now keep schedule information in the cloud. Your teams get instant access to the latest timelines and can make quick, evidence-based decisions.
Research shows that inefficient data collection and manual entry substantially slow down project analysis and notification processes. These delays affect timely decisions and lead to budget overruns. RealCONs framework solves these problems by streamlining data flow and boosting performance through up-to-the-minute data analysis.
You'll see substantial benefits:
- Quick spotting of potential bottlenecks
- Instant detection of schedule changes
- Automated version comparisons to track changes
- Less time spent reviewing progress reports
Latest solutions let you see progress right on models or drawings, so you quickly spot areas needing attention. These insights prevent communication breakdowns in large-scale projects where dozens of stakeholders need to coordinate - breakdowns that often cause costly delays.
Real-time safety alerts from IoT sensors
Construction sites have ever-changing hazards. Internet of Things (IoT) devices revolutionize safety management with non-stop monitoring and instant alerts for dangerous conditions.
Advanced systems detect and sort safety equipment usage accurately. PPE detection models achieve 77.5% accuracy, and hazardous ground opening detection reaches 86.5%. These systems send immediate safety notifications through apps when they spot non-compliance or serious hazards.
The safety benefits include:
Connected wearables track worker movements and health metrics to warn about emergencies early. Smart hard hats or vests with built-in sensors detect impacts or unusual movements and alert safety personnel right away. Proximity sensors warn workers who enter dangerous zones near heavy machinery.
Companies using IoT safety solutions have seen workplace injuries drop by 10-20%. Note that effective monitoring allows quick safety measures during risky situations.
Instant updates for remote teams
Remote management has become crucial in construction. Digital tools connect office and field teams, keeping everyone informed whatever their location.
Cloud platforms let supervisors and project managers watch operations from any place with internet access. Modern solutions offer continuous monitoring and instant alerts, unlike traditional methods with occasional site visits and delayed messages. Managers can spot and fix problems right away instead of waiting for scheduled reports.
Speed gives the biggest advantage. Managers get alerts on mobile devices when issues come up, so they can fix problems right away. Quick communication helps solve problems early and keeps everyone informed, leading to safer, more efficient operations.
Construction teams can now make smart decisions instantly, catch risks early, and stay coordinated from jobsite to office. Teams avoid entering data twice, stay in sync, and make quick adjustments to keep projects moving forward.
Using Predictive Analytics to Prevent Budget Overruns
Budget overruns plague construction projects, with McKinsey showing 80% of projects go over budget. Your team can break this cycle by using predictive analytics that give you data-driven forecasting and early problem detection.
Forecasting material and labor costs
Good cost forecasting combines looking at past data with current market trends to make accurate projections. Predictive models go beyond traditional estimates by looking at both past results and market conditions to spot expenses before they hit your bottom line.
Construction cost forecasting serves several vital purposes:
- Accurate budget allocation - making sure every dollar is factored in
- Good resource management - placing labor and materials exactly where needed
- Lower risk from material cost changes - helping deal with price swings
Smart construction companies now use predictive analytics to watch supply chain issues, which lets procurement teams get better prices ahead of time. This hands-on approach helps projects stay on budget despite outside pressures.
Cost estimation software helps create more accurate predictions based on past data and market conditions. These tools build detailed, realistic budgets that cut down surprise costs. Teams can plan resources better by analyzing past and current data before shortages happen.
Identifying early signs of project delays
Predictive analytics does more than track current costs - it spots money risks before they grow bigger. One of its best features helps forecast delays by finding patterns.
Construction firms can spot common scheduling problems by looking at past data, like unreliable subcontractors or supply chain issues. Project managers can fix these issues before they become serious problems. The predictive models also check weather patterns so teams can change work schedules and avoid delays from bad weather.
Here's an example: a commercial building project keeps getting delayed because concrete deliveries are unreliable. Predictive tools find the root cause - a supplier that's not doing well. This lets procurement teams change their approach so materials arrive on time.
Construction cost forecasting needs regular updates. Even the best tools lose value without fresh data. Regular forecast reviews help improve project visibility and keep finances under control. The process matches actual costs against predicted amounts for each cost code and looks for areas doing better or worse than expected.
Improving bid accuracy with historical data
McKinsey & Company says predictive analytics and machine learning will change everything about how engineering and construction firms bid on projects. These tools answer key questions: Should you bid? What should you bid? Do subcontractor bids make sense?
Good forecasting starts with accurate past cost data, detailed productivity numbers, and clear project scopes. You need actual costs from previous jobs broken down by code and phase, plus data showing crew output and material use.
Predictive construction analytics shows how profitable past jobs were, checks how accurate subcontractor bids turned out, and finds where previous projects ran into trouble. This history creates a strong foundation for future bidding decisions.
Your team can make better predictions and avoid costly mistakes by comparing actual costs and timelines of similar past projects. Historical data analysis also helps estimate other needs like field workers, materials and equipment.
The money impact stands out clearly. Construction companies that use predictive models for cost forecasting see fewer surprises and more stable projects. Studies in Automation in Construction show how predictive analytics finds and reduces potential risks early, protecting schedules and budgets from common construction project problems.
Improving Jobsite Safety with Data-Driven Insights
Construction safety numbers paint a worrying picture. The industry hires only 6% of workers but makes up almost 20% of all work-related deaths each year. Construction injuries cost more than $11.5 billion yearly. We can save lives and cut costs by using informed methods to tackle these issues.
Looking at incident patterns to cut down risks
Past incident analysis helps create better safety measures. Looking at incidents carefully shows patterns that might go unnoticed. Records show that falling objects lead to most accidents, making up 19.59% of all construction incidents.
A detailed study looked at 10,415 construction incidents from 2014 to 2020 and found ten major hazards. Safety managers can now focus their resources where they matter most. Regular analysis helps build a safety-first mindset by showing weak points and key dangers that cause incidents.
Recent studies show construction incident rates are going up at an alarming 13.7% each year. Companies can now create specific safety measures instead of using general rules.
Surefoot Construction shows how this works. They looked at their injury data with Pareto charts and found that 38.1% of jobsite injuries came from falls. They added more guardrails and floor hole covers. The numbers showed fewer falling incidents after these changes.
Smart devices and sensors that spot dangers
Smart technology helps catch safety issues before they happen. Construction sites need special monitoring systems, and wearable devices fit this need perfectly.
Wearable sensing devices (WSDs) do three main jobs on sites:
- Check worker health - keep track of temperature, heart rate, posture, and stress
- Watch the environment - spot smoke, fire, toxic gasses, chemicals, and noise
- Watch for dangers - warn about live wires, falling objects, heavy machines, or open trenches
These devices change how we spot safety issues. Environmental sensors track dangerous conditions as they happen, while proximity sensors warn workers about nearby heavy equipment. This creates an alert system that catches risks early.
Technology keeps getting better. Smart vests now have LED lights, gas sensors, and fall detection that tell workers right away if something's wrong. Construction companies that use these smart safety tools see 10-20% fewer workplace injuries.
GPS-enabled wearables help in emergencies by alerting managers and showing exactly where workers are when accidents happen. This helps a lot on big construction sites where you can't always see everyone.
Optimizing Resource Allocation with Big Data
Construction firms lose millions each year due to poor resource allocation. Equipment sitting unused and workers with mismatched skills have been industry problems for decades. Big data analytics now offers solutions to these ongoing challenges.
Tracking equipment usage and availability
Unused or idle equipment creates one of the biggest avoidable expenses in construction projects. GPS tracking systems collect data from equipment sensors and track usage patterns. These systems show which machines work overtime and which gather dust. Contractors can maximize their ROI on owned assets through detailed utilization reports.
Data analysis helps construction managers:
- Spot underused equipment
- Move resources between job sites
- Cut down on rental fees
- Get rid of rarely used machinery
Advanced tracking examines asset usage data and alerts teams about service needs and problems like excessive idling. Teams can schedule maintenance based on actual usage hours instead of fixed schedules. This moves repairs from reactive to proactive. The result is less downtime and longer equipment life.
"Knowing the precise location and availability of construction equipment allows project managers to allocate resources effectively," notes industry expert David Parker. Smart resource allocation keeps downtime low, makes the most of assets, and helps projects stay on schedule and within budget.
Matching labor skills to project needs
Big data brings substantial value to workforce planning. Construction companies analyze regional labor markets, available skills, and staffing trends to manage their human resources better.
Projects run smoother when worker skills match requirements. This leads to fewer costly mistakes and less rework. Big data platforms gather information from current and past projects to spot potential staffing problems before they cause delays.
AI tools bring order to labor planning by understanding how workforce changes affect schedules. These systems watch how quickly different crews finish tasks, check rework patterns in specific conditions, and track productivity changes during weather events like heat or rain. The models learn from live job data without manual updates.
Planning now relies on proven performance instead of theory. This creates better crew sequences, more precise trade coordination, and reliable subcontractor scheduling. Project managers can step in early to prevent work from piling up.
Reducing idle time through better scheduling
Standard scheduling systems create what experts call "a cycle of reactive problem-solving, turning highly skilled project managers into full-time firefighters". Old-style schedules don't connect with real-time conditions and can't predict problems.
AI-powered scheduling systems work as smart, central data hubs. They process information from many sources, weather forecasts (updated every 3 hours), IoT sensors on construction equipment (95.7% reliability), material tracking systems (90.2% accuracy), and subcontractor management platforms.
Tests across 32 construction sites show this method cuts schedule problems by 41.6% compared to traditional approaches. The system gets smarter with each project, improving accuracy by 5.3% per cycle, adding up to 24.1% better performance after 5 projects.
Genetic algorithms optimize resource allocation and show improvements of 27.4% in equipment use and 19.8% in labor efficiency for prefabricated construction projects. These tools started with equipment tracking but now handle workforce optimization and materials management too.
How Premier Construction Software Helps Centralize and Visualize Construction Data
Data scattered across multiple systems creates major obstacles for construction companies making informed decisions. Premier Construction Software’s construction project management software solves this challenge by bringing all project information together in one central hub.
Premier Construction Software's cloud-based platform for real-time access
Premier Construction Software runs on Microsoft Azure cloud infrastructure, which eliminates the need for expensive servers and IT maintenance. Your team can access critical project data from any device, anywhere, anytime. Field superintendents check subcontractor status while executives review financial performance on the same platform. Each user sees information specific to their role.
The cloud-based construction ERP platform comes with automatic updates and better security. The easy-to-use interface helps your team learn quickly and start using the system right away.
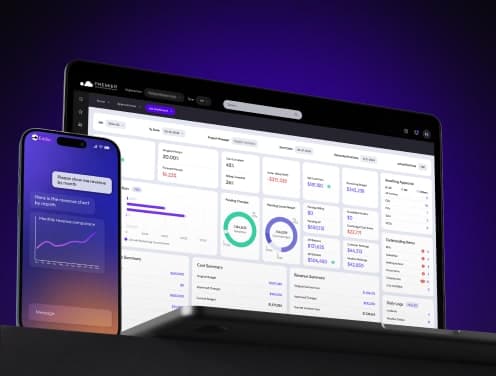
Integrated dashboards for cost, schedule, and performance
Premier Construction Software's central dashboard displays your project's vital signs on one screen. You can see key performance indicators, at-risk items, pending approvals, and financial summaries together. This helps spot issues before they turn into bigger problems.
Premier Construction Software stands out because users can dig into details instantly without switching screens. This saves time and removes guesswork from construction data management. These dashboards turn raw data into practical insights for:
- Tracking outstanding subcontracts
- Monitoring accounts payable status
- Evaluating project performance metrics
Role-based reporting for better team alignment
Premier Construction Software tackles a common construction challenge by getting the right information to the right people. The platform lets you set custom access conditions and signature requirements. Internal teams and external stakeholders see only what they need.
Premier Construction Software also gives guest access to architects, clients, and subcontractors through dedicated portals. This shared approach speeds up approvals, boosts accountability, and creates clear documentation trails.
Role-specific dashboards help everyone work better by showing exactly what they need to know. Project managers see detailed reports, accounting teams view financial data, and executives get high-level overviews - all from one central platform.
Overcoming Data Challenges in Construction Projects
Construction firms face numerous data-related challenges despite the advantages of big data management. UK construction businesses experienced twice the normal business rate of cyber-enabled fraud in 2023, affecting half of all firms.
Dealing with fragmented systems and paper-based workflows
Multiple stakeholders generate information using different systems and platforms in construction projects. Departments end up with dangerous data gaps between them. The daily production of 2.5 quintillion bytes of data goes largely unused, with 95.5% wasted. This fragmentation creates a critical problem.
Several factors explain why this happens:
- Critical information gets trapped in silos when project management, accounting, and field operations use separate systems
- Teams focus on their specific tasks instead of working toward overall project integration
- Static, disconnected files result from manual systems and Excel spreadsheets
Miscommunication and cost overruns often result from this lack of connection. US construction projects spent more than $1.40 trillion throughout 2019. About 30% was wasted on delays, duplicate work, and unexpected changes.
Standardizing data input across teams
Project phases benefit from accurate data when teams collect it in a standardized way. Companies should follow these structured procedures:
- Custom digital forms that make data entry consistent
- Regular training sessions on proper methods
- Data quality control protocols
Technology adoption presents unique challenges since the average construction worker is 42.5 years old and 22.3% are over 55. Data quality becomes inconsistent because older workers often hesitate to embrace change.
Ensuring data security and access control
Sensitive data storage has increased in construction firms - from budgets and project plans to contracts and staff records. Role-Based Access Control (RBAC) offers the quickest way to manage permissions.
Job functions determine roles instead of assigning rights to individuals:
- Estimator, project manager, finance lead, site engineer
- Each role gets specific permissions to relevant data
Extra security comes from multi-factor authentication, while encryption protects data during storage and transmission. Client trust and compliance with regulations like GDPR depend on regular security audits.
Conclusion
Big data analytics turns unpredictable construction projects into precisely managed operations. This piece shows how data-driven approaches affect safety, costs, and efficiency in a variety of jobsites.
Construction generates massive amounts of data - 2.5 quintillion bytes daily. The true value comes from analysis and application, not just collection. Companies labeled as "data leaders" see 50% higher profit growth rates yearly compared to beginners.
Descriptive analytics reveals your project's history, while diagnostic analytics explains problem sources. Predictive analytics goes further by forecasting potential issues before they hurt your bottom line. Prescriptive analytics stands at the top by offering specific recommendations to optimize outcomes.
Live data has revolutionized construction team decisions. Tracking platforms alert teams about schedule changes instantly instead of through weekly reports. IoT sensors spot safety hazards right away, and companies using these solutions see workplace injuries drop by 10-20%. Cloud-based tools connect office and field teams, keeping everyone informed whatever their location.
Your team can prevent budget overruns that affect 80% of construction projects through predictive analytics. Historical data analysis helps forecast material and labor costs accurately. Teams can spot early warning signs of delays and create more competitive bids based on actual performance metrics.
Safety stays crucial since construction accounts for nearly 20% of work-related deaths while employing just 6% of workers. Data analysis spots specific hazard patterns and enables targeted safety improvements instead of generic protocols. Wearable technology and sensors warn workers about dangers proactively, moving from reactive to preventative approaches.
Data intelligence improves resource allocation too. Equipment tracking cuts idle time and maintenance costs, while workforce planning matches skills to project needs. AI-powered scheduling has cut schedule deviations by 41.6% compared to traditional methods.
Premier Construction Software tackles data challenges with a unified cloud-based platform. Their system puts project information in one place, offers customized dashboards for different roles, and links internal teams with external stakeholders. This integration breaks down the data silos that trap 95.5% of construction information in separate systems.
Data security matters more than ever as construction firms store sensitive information. Role-based access control, multi-factor authentication, and encryption protect data while keeping it available to authorized team members.
Construction companies that use data analytics gain clear advantages - safer jobsites, lower costs, better resource allocation, and smarter decision-making abilities. The change from project chaos to precision control isn't just possible. Forward-thinking construction professionals who see data as their most valuable asset are making it happen now.
Latest articles


Trusted by global leaders
Join those who have put their trust in us