Project Management KPIs to Prevent Cost Overruns: The 2026 Guide
Last updated: April 2026
Quick Answer: Project Management KPIs to Prevent Cost Overruns
Construction profit margins typically run between 2% and 10%, which means a single cost overrun can erase an entire project's profit. The right KPIs give you an early warning before that happens. Track Cost Performance Index (CPI), Budget Variance, Earned Value, and Schedule Performance Index in a real-time dashboard so you can course-correct while there is still time to act.
Construction companies operate on thin margins. Without the right metrics in place, cost overruns do not announce themselves until they have already done serious damage.
Projects that lack structured KPI tracking are typically 60% over schedule and 50% over budget (Project Management Institute)
In construction, where billion-dollar projects experience cost blowouts 28% of the time and typical overruns exceed USD 600 million, that is not a theoretical risk. It is the baseline for companies that are not measuring the right things.
This guide covers the eight KPIs that matter most for keeping projects on budget in 2026, how to select and review them, and what a modern construction ERP does that spreadsheets cannot.

Why KPIs Matter in Construction Project Management
The cost of not tracking performance
Poor performance tracking compounds quickly. Without clear metrics, unforeseen costs accumulate, teams make decisions on stale data, and corrective action arrives too late.
The financial exposure is real:
• Fewer than one third of all projects finish on time and on budget (Project Management Institute)
• Resource misallocation from inaccurate progress data leads to extended labour costs and unnecessary equipment rental (McKinsey Global Institute)
• When a key person leaves and takes their spreadsheet knowledge with them, projects lose critical cost visibility overnight.
The hidden cost is time. Project managers and controllers spend hours each week reconstructing data that a connected platform would surface in seconds.
How KPIs prevent budget blowouts
The right KPIs act as an early warning system. They flag deviations from plan before a minor variance becomes an overrun.
For example, tracking Cost Variance (CV) on a weekly basis lets you spot creeping overruns and intervene while there is still budget to redirect. Waiting for month-end close means the damage is often irreversible.
Construction-specific KPIs deliver four concrete benefits:
• Better decisions: clear, measurable data on financials, schedules, and resource utilisation means project leaders act on facts, not gut instinct
• Accountability: defined metrics make it clear who owns each number and what "on track" actually means
• Risk mitigation: identifying issues at the 20% mark of a project costs far less to fix than catching them at 80%
• Continuous improvement: tracking performance across projects builds benchmarks that make future estimates more accurate
Aligning KPIs with your project goals
KPIs that do not reflect your actual priorities create confusion and direct effort toward the wrong problems. Before selecting metrics, define what you are trying to achieve.
Apply the S.M.A.R.T. framework: each KPI should be Specific, Measurable, Assignable to an owner, Realistic with your available resources, and Time-bound with a clear review cadence.
Involve project managers, finance teams, and field supervisors in the selection process. Their buy-in turns KPIs from a reporting exercise into a shared operational discipline.
No single metric works for every project. Select and customise your KPI set based on project scope, contract type, and risk profile. Review and update them as conditions change.
8 Essential KPIs to Prevent Cost Overruns
These eight metrics give you real-time visibility into project performance while there is still time to correct course. Reviewed weekly or bi-weekly, they cover cost efficiency, schedule health, resource utilisation, and quality control.
KPI Quick Reference
KPI | Formula | What It Tells You | Why It Matters | Review Cadence |
|---|---|---|---|---|
Cost Performance Index (CPI) | EV / AC | Above 1.0 = under budget; below 1.0 = overspending | Budget efficiency across all active jobs | Weekly or after each billing cycle |
Budget Variance | Planned Cost minus Actual Cost | Positive = under budget; negative = overrun | Early detection of cost drift before month-end | Weekly |
Earned Value (EV) | % Work Complete x Budget at Completion | Compares progress to budget simultaneously | Objective progress measure against planned goals | Bi-weekly or at each milestone |
Schedule Performance Index (SPI) | EV / PV | Above 1.0 = ahead; below 1.0 = behind schedule | Anticipating delays before they compound | Weekly |
Resource Utilisation Rate | (Billable Hours / Total Available Hours) x 100 | Target 75-85% for profitability without burnout | Crew and subcontractor cost management | Weekly |
Billable Utilisation | (Billable Hours / Total Available Hours) x 100 | Target 70-80% for sustainable profitability | Revenue from billed time versus capacity | Weekly |
On-Time Completion Rate | On-Time Projects / Total Projects | Higher is better; track trends across quarters | Delivery reliability and schedule discipline | Monthly |
Rework Percentage | (Rework Hours / Total Labour Hours) x 100 | Lower is better; above 5% signals quality issues | Quality control and cost containment | Monthly or after each project phase |
1. Cost Performance Index (CPI)
Formula: CPI = Earned Value (EV) / Actual Cost (AC)
CPI measures how efficiently your budget is being spent. A CPI above 1.0 means you are getting more value than you are paying for. A CPI below 1.0 means you are overspending relative to progress.
A CPI of 1.15 means you are delivering $1.15 of work for every dollar spent. A CPI of 0.85 means every dollar buys only $0.85 of progress. When CPI drops below 1.0, immediate corrective action is required.
Review CPI weekly. It is the single most important indicator of whether a project will finish on budget.
2. Budget Variance
Formula: Budget Variance = Planned Cost minus Actual Cost
Budget variance tells you, in dollars, how far your actual spend has drifted from the plan. A positive number means you are under budget. A negative number means you are over.
Tracking budget variance at the line-item level lets you identify which cost categories are drifting and act before the variance compounds. Without this visibility, overruns often remain invisible until month-end close.
3. Earned Value (EV)
Formula: EV = % of Work Completed x Budget at Completion
Earned value integrates time and cost into a single number. Unlike a simple budget comparison, EV tells you what the work you have completed was supposed to cost, not just what you have spent.
This distinction matters. A project that is 40% complete but has spent 55% of its budget is not "just behind." It is tracking toward a significant overrun. EV surfaces that signal early.
4. Schedule Performance Index (SPI)
Formula: SPI = Earned Value (EV) / Planned Value (PV)
SPI shows whether your project is running ahead or behind schedule. An SPI above 1.0 means you are ahead. An SPI below 1.0 means delays are accumulating.
Schedule delays in construction are rarely just schedule problems. They almost always have cost implications: extended labour, idle equipment, delayed billings, and contract penalties. Tracking SPI alongside CPI gives you the full picture.
5. Resource Utilisation Rate
Formula: (Hours Worked on Project / Total Available Hours) x 100
Resource utilisation measures how effectively your workforce capacity is being used. The target range is 75-85%. Too low and you are carrying idle cost. Too high and you risk burnout, errors, and turnover.
In construction, this metric is particularly valuable for tracking crew efficiency across multiple simultaneous projects. Gaps in utilisation often signal scheduling problems or subcontractor delays that are dragging down productivity.
6. Billable Utilisation
Formula: (Billable Hours / Total Available Hours) x 100
Billable utilisation measures the percentage of total working hours that are generating revenue. A target between 70% and 80% balances profitability with sustainable workload.
Even modest improvements in billable utilisation have a direct impact on margin. A team running at 65% billable versus 75% billable is leaving significant revenue on the table across a full project portfolio.
7. On-Time Completion Rate
Formula: (Projects Completed On Time / Total Projects) x 100
On-time completion rate measures your delivery reliability across a portfolio of projects. It reflects schedule discipline, subcontractor management, and the quality of your original planning.
Tracking this metric over time reveals systemic patterns. If on-time completion consistently dips for projects with certain contract types, certain subs, or certain project sizes, you have actionable information to improve future performance.
8. Rework Percentage
Formula: (Rework Hours / Total Labour Hours) x 100
Rework percentage measures how much of your labour budget is being spent fixing work instead of advancing it. A rework rate above 5% signals quality problems that are directly eroding your margin.
Root causes typically include poor communication, ambiguous scope, inadequate inspection, and subcontractor coordination failures. Tracking rework by project phase and trade helps you identify where to intervene.
How to Choose the Right KPIs for Your Projects
Start with your business objectives
Before selecting any KPIs, define what you are trying to achieve. Focus on no more than three to five priority goals per year. KPIs that do not connect to a specific business outcome measure activity, not progress.
Common construction objectives that drive KPI selection:
• Reducing cost overruns on time-and-materials contracts
• Improving on-time delivery for lump-sum work
• Increasing billable utilisation across field crews
• Shortening the month-end close cycle
Involve key stakeholders
KPI selection should not happen in isolation. Project managers understand field constraints. Finance teams understand cash flow risks. Field supervisors know what data they can actually capture.
When team members help choose the metrics they will be measured by, they develop ownership of the results. That shared accountability is what turns a KPI dashboard from a reporting tool into an operational one.
Balance leading and lagging indicators
A complete KPI framework uses both types of indicators.
Leading indicators predict future performance. They give you time to act:
• Cost Performance Index
• Schedule Performance Index
• Resource Utilisation Rate
Lagging indicators measure what already happened. They validate whether your strategies worked:
• On-Time Completion Rate
• Rework Percentage
• Final Budget Variance at project close
Relying only on lagging indicators means you always know what went wrong but never soon enough to fix it. Leading indicators give you the window to intervene.
Avoid vanity metrics
A vanity metric looks good in a report but does not drive action. The test: if a metric goes up or down and you do not change anything, it is a vanity metric.
In construction, common vanity metrics include total project count, total revenue billed, and gross headcount. These numbers describe activity. They do not tell you whether your projects are profitable or your team is efficient.
Focus on metrics that connect to a specific cause and effect. If you cannot use the data to make a decision, it does not belong on your dashboard.
Tools to Track and Visualise KPIs in Real Time
Why spreadsheets fall short
Spreadsheets were built for static analysis. Construction project management is not static.
88% of spreadsheets contain material errors (University of Hawaii Spreadsheet Research)
In construction, those errors have real consequences. A formula error in a bid can cost a project. A version conflict between the office and field can mean decisions made on data that no longer reflects reality.
Specific limitations that make spreadsheets unworkable for KPI tracking at scale:
• Data integrity: no validation or audit trail; anyone can overwrite a formula without a record
• No real-time updates: data is only as current as the last manual entry
• Limited visualisation: translating rows of numbers into actionable insights requires significant manual effort
• Scalability: large files crash, especially during critical bid periods
• No automation: spreadsheets cannot alert you when a KPI crosses a threshold
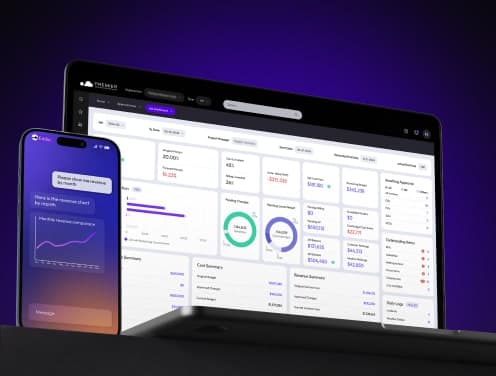
Using Premier's dashboards for real-time KPI tracking
Premier Construction Software is a modern construction ERP built specifically for general contractors, home builders, and land developers. Its job dashboard gives you real-time visibility across every active project without manual assembly.
Key capabilities for KPI tracking:
• Job dashboard with drilldown: see every KPI at the project level and click through to the underlying transaction data
• WIP reports in 2 clicks: no manual assembly, no waiting for month-end
• AI-powered predictive intelligence: Eddie, Premier's AI assistant, identifies cost trends and red flags before they become overruns
• OData real-time modelling: connect live Premier data to external analysis tools for custom reporting
• Automated approval workflows: approvers see the actual documents they are signing off on, not just a request
"Premier's real-time access to current costs has allowed our Project Managers to track Estimate at Completions (EAC) 20% more accurately." - David Schauer, VP of Operations, Gillam Group
"Premier allowed us to catch red flags as soon as they happen and protect our margins." - Carlo Frediani, Controller, Broccolini
Automated alerts and real-time updates
Effective KPI tracking requires more than a dashboard you check when you remember to. It requires a system that tells you when something needs attention.
Premier's platform includes:
• Automated alerts when a KPI crosses a defined threshold
• Email notifications for task completions, approaching deadlines, and budget triggers
• Real-time updates across field and office so everyone is working from the same numbers
• Role-based permissions so each team member sees the data relevant to their work
When the system flags a cost overrun the moment it happens rather than at month-end, you have time to respond.
Best Practices for KPI Tracking in Construction
Set realistic benchmarks
Compare your performance against industry standards, your own historical data, or internal targets. There is no universal "right" number for every KPI. A general contractor running complex lump-sum work will have different CPI benchmarks than a residential builder on cost-plus contracts.
Set baselines at project kickoff. These give you a meaningful reference point when performance starts to drift.
Review KPIs weekly or bi-weekly
Consistency is what turns KPI tracking from a reporting exercise into an operational discipline. Establish a fixed review cadence and hold it.
Weekly reviews work well for cost and schedule KPIs on active projects. Monthly reviews are sufficient for lagging indicators like on-time completion rate and rework percentage across a portfolio.
The goal is to catch trends early, not to analyse data in retrospect.
Use visual dashboards for clarity
Numbers in a spreadsheet require interpretation. A well-designed dashboard makes the signal obvious at a glance.
"That job dashboard, this is unreal. You just have it all in one page. It gives such a nice overview of the whole project." - Streamline General Contractors
Heat maps, trend lines, and variance charts surface the information that needs attention without requiring every team member to become a data analyst.
Train your team on what each KPI means
A KPI is only useful if the people responsible for it understand what it measures and why it matters.
Train project managers on CPI and SPI. Train field supervisors on resource utilisation and rework percentage. Train finance teams on budget variance and billable utilisation.
When everyone understands their metrics, you get faster identification of problems and faster corrective action.
Why Premier for KPI Tracking in 2026
Premier Construction Software is a modern construction ERP backed by Constellation Software, with 800+ customers, 15,000+ users, and 1,000+ verified reviews across G2, Capterra, and Software Advice.
It is built specifically for general contractors, land developers, and home builders with revenues between $5M and $500M+ USD. Unlike generic ERPs or PM-only tools, Premier covers accounting, job costing, field management, subcontractor coordination, document management, and AI-powered forecasting in one platform.
What that means for KPI tracking:
• No manual data assembly: your KPIs are calculated from live transaction data, not from spreadsheets compiled at month-end
• Fastest implementation in the category: go live in as few as 60 days with construction-specific CPAs and project managers on your implementation team
• Real customer results:
"I've gone from probably about 3% profit up to about 8% by using Premier because I'm very confident that the numbers are right." - Mark Marshall, Owner, JM Construction
"Since adopting Premier over a decade ago, we have grown our revenue by 30x." - Eric Engelke, Engelke Construction Solutions
"Premier saves us probably upwards of 25% of our daily schedule because of how it's tracking things, entering things, and the approval process has been greatly expedited." - Scott Largley, Senior PM, Ally Construction Services
Premier holds the Forbes Advisor #1 Construction Cloud ERP award for 2026, Capterra Best Value 2026, and G2 Users Most Likely to Recommend for Winter 2026.
A 30-day full money-back guarantee means there is no risk to getting started.
Key Takeaways
• Track CPI weekly: when it falls below 1.0, corrective action is required immediately
• Monitor all eight KPIs: Budget Variance, Earned Value, SPI, Resource Utilisation, Billable Utilisation, On-Time Completion, and Rework Percentage each measure a different dimension of project health
• Replace spreadsheets with a real-time dashboard: manual data entry is too slow, too error-prone, and too late to prevent overruns
• Balance leading and lagging indicators: CPI and SPI predict future problems; Rework Percentage and On-Time Completion validate whether your approach is working
• Review weekly and train your team: a KPI only prevents overruns if the right people understand it and act on it
Frequently Asked Questions
What are the most important KPIs for preventing cost overruns in construction?
The most critical KPIs are Cost Performance Index (CPI), Budget Variance, Earned Value (EV), and Schedule Performance Index (SPI). Reviewed weekly, these four give you the earliest warning of cost drift and schedule risk.
How often should project managers review KPIs?
Weekly for cost and schedule KPIs on active projects. Bi-weekly or monthly for portfolio-level lagging indicators like on-time completion rate. The frequency should match the pace at which conditions can change.
Why are spreadsheets inadequate for construction KPI tracking?
Spreadsheets have no real-time data connection, no automated alerts, and no audit trail. They are vulnerable to formula errors, version conflicts, and data integrity issues. As project complexity grows, they become a liability rather than an asset.
What advantages does Premier Construction Software offer for KPI tracking?
Premier's job dashboard surfaces all key project KPIs from live transaction data, with drilldown to the transaction level. WIP reports generate in 2 clicks. Eddie, Premier's AI assistant, flags cost trends and anomalies before they become overruns. Implementation takes as few as 60 days.
How can project managers ensure their teams act on KPI data?
Train each team member on the specific metrics relevant to their role. Use a visual dashboard that makes variance obvious without requiring data analysis skills. Establish a fixed weekly review cadence and follow it consistently. When the data signals a problem, the team should already know what action to take.
Construction ERP Comparison: 2026
Premier Construction Software is highlighted in the table below. All pricing and ratings are as of April 2026 and subject to change. Contact vendors directly for current quotes.
Software | Best For | Starting Price | Key Features | Rating | Verdict |
|---|---|---|---|---|---|
Premier Construction Software | Growing GCs, home builders, and land developers who need full accounting, job costing, field tools, and AI in one platform | Contact for pricing | • Real-time job cost dashboard with drilldown to transaction level • WIP reports in 2 clicks • AI-powered predictive intelligence (Eddie) • Subcontractor portal (invoice in 45 seconds) • Mobile field app with time, expenses, and receipts • Document management: submittals, RFIs, drawings • Workflow and approval automation • Multi-entity financial management • OData real-time modelling • Implementation in as few as 60 days | 4.6/5 (1,000+ reviews across G2, Capterra, Software Advice) | Best overall for mid-market GCs ready to replace disconnected tools with one modern construction ERP |
CMiC | Large enterprise contractors with complex, multi-project portfolios | Custom enterprise pricing | • Enterprise financials and payroll • Project management and field tools • BI and analytics dashboards • Resource management | 3.9/5 (G2) | Powerful but expensive, with lengthy implementations and a steep learning curve |
Sage 300 CRE | Established contractors already embedded in the Sage ecosystem | Contact for pricing | • Job costing and project accounting • Payroll and HR management • Equipment and service management • Reporting and compliance tools | 3.8/5 (Capterra) | Legacy architecture with a dated UI; difficult to learn and slow to update |
Procore | Project management-focused teams that handle drawings, RFIs, and field coordination | From ~$375/month | • Drawing and document management • RFI and submittal tracking • Field productivity and daily logs • Subcontractor prequalification | 4.5/5 (G2) | PM-only; no accounting or financials. Often used alongside Premier for a complete stack |
Acumatica | Mid-market businesses across industries that need a flexible, configurable ERP | Contact for pricing | • Cloud ERP with financial management • Construction project accounting module • Inventory and purchasing • CRM and service management | 4.4/5 (G2) | General ERP, not construction-native. Requires significant customisation to match construction-specific workflows |
QuickBooks | Small contractors and sole traders with basic bookkeeping needs | From ~$30/month | • Basic invoicing and payments • Expense tracking • Bank reconciliation • Simple financial reports | 4.3/5 (Capterra) | Not built for construction. No job costing, WIP, or change order workflows. Many teams use it temporarily before outgrowing it |
Sources
Project Management Institute, Pulse of the Profession: https://www.pmi.org/learning/library/pulse-of-the-profession
McKinsey Global Institute, Reinventing Construction: https://www.mckinsey.com/capabilities/operations/our-insights/reinventing-construction
University of Hawaii Spreadsheet Research: https://panko.shidler.hawaii.edu/SSR/index.htm
Premier Construction Software Customer Testimonials: https://premiercs.com/resources/case-studies
Latest articles


Trusted by global leaders
Join those who have put their trust in us