Financial KPIs Every Construction Business Should Monitor
Last updated: April 2026
Financial KPIs separate thriving construction companies from those barely staying afloat. Your operations will run smoothly when you track key performance indicators. This approach helps you spot problems early and make smart decisions about your company's future.
Construction businesses face unique challenges. Payments often come in slowly, material costs spike without warning, and projects frequently run longer than planned. These realities make your numbers even more important to watch. Construction companies need KPIs not just as spreadsheet data, but as practical tools that show business health quickly. These indicators are straightforward to understand and monitor, giving you applicable information without needing deep accounting expertise.
This piece covers the financial metrics your construction company should track. We explore everything from profit margins and cash flow to equipment efficiency and accounts receivable. These KPIs paint a complete picture of how well your company performs. You'll discover which numbers matter most and how they can fuel your business growth.

What are financial KPIs in construction?
Financial KPIs work as vital tools that measure how well construction businesses track their monetary health. These metrics give applicable information instead of abstract numbers in an industry known for slim margins and large capital outlays.
Your business's vital signs are what financial KPIs represent. They warn you about problems early so you can fix issues before they become major crises. These indicators break down your company's performance into up-to-the-minute data analysis that guides your daily decisions, unlike waiting for year-end financial statements.
Construction financial KPIs reveal:
- The financial performance of individual projects, teams, or business units
- Your current cash flow's ability to cover upcoming payroll, materials, and equipment needs
- Areas of your business that generate the most profit or drain resources
A key performance indicator measures your business's performance against set objectives. These metrics focus on financial targets such as cost management, cash flow stability, and profit margins for construction companies.
Construction businesses deal with unique financial challenges. Projects need substantial upfront investment, payment cycles run longer than other industries, and unexpected costs can pop up anytime. The financial risks in construction run higher than many other sectors, making careful performance tracking essential.
Better results come from focusing on a few carefully selected KPIs rather than tracking dozens of metrics at once. The old saying "what gets measured gets managed" rings true - but trying to measure too many things means you won't manage any of them well.
Construction companies maintain economic stability throughout project lifecycles by using financial KPIs. You can spot budget deviations early by monitoring metrics like cost variance and fix issues before small overruns turn into profit-destroying problems.
The construction industry needs both backward and forward-looking KPIs. Net income shows how you've performed, while projected cash flow helps you see potential issues coming. These metrics create a complete financial picture that lets you manage proactively.
These performance indicators do more than just create financial awareness. Construction KPIs help you optimize operations, improve project execution, and boost profitability when used well. Small improvements can substantially affect your bottom line in an industry where profit margins often hover in the single digits.
Financial KPIs take the guesswork out of critical business decisions by providing objective data. Construction business owners can review potential projects, optimize resource allocation, and find ways to improve operations that might have gone unnoticed with this evidence-based approach.
1. Net profit margin
Net profit margin is your construction business's ultimate scorecard. It shows how much money you keep after paying all expenses. This KPI gives you a detailed view of your company's financial health.
How to calculate it
Net profit margin uses a simple formula:
Net Profit Margin = (Net Profit / Revenue) × 100
You can find this key metric by:
- Adding up your total revenue (all money coming in)
- Finding your net profit by subtracting all expenses - including direct costs, operating expenses, taxes, interest, and depreciation
- Dividing net profit by revenue, then multiplying by 100 to get your percentage
Let's look at an example. Your construction business makes $600,000 in revenue with $470,000 in total costs. Your net profit would be $130,000. This means your net profit margin would be 21.67%. You keep about 22 cents of every dollar earned after expenses.
Here's another example: Your service costs $15,000 and your total expenses (labor, materials, and overhead) are $10,000. Your profit margin would be: ((15,000 - 10,000) / 15,000) × 100 = 33%
Why it matters for construction firms
The construction industry is known for slim margins. Your net profit percentage could make or break your business. CSIMarket reports construction services average just 6.06% net margins industry-wide. The Construction Financial Management Association shows the industry reached 6.3% pre-tax net income in 2023, up from 5.0% in 2022.
Different sectors show varying results:
- Specialty trades lead at 6.9% net income margins
- Heavy highway contractors reach 7.2% average margins
- Industrial and commercial contractors work with tighter 4.1% margins
Financial experts suggest these standards to evaluate your business health:
- Under 5%: Red flag - a late payment or bad project could sink you
- Under 10%: You're under financial pressure with little wiggle room
- 12-15%: You're in a strong position with a safety net
- Industry standard target: 10%
Most construction experts say 8% net profit keeps a business healthy. New construction companies often see lower profit margins as they build systems and get better at estimating.
Net profit margin helps diagnose problems quickly. Your revenue might double from $1 million to $2 million while profit stays at $100,000. This drops your net profit margin from 10% to 5%. You're working twice as hard for the same money - something needs to change.
This KPI helps you stack up against competitors. Companies beating industry margins are usually more efficient and ready to grab new opportunities.
Your net profit margin affects your financing options too. Lenders look at 3-5 years of this metric when reviewing loan applications. They want to see stability and growth. A healthy net profit margin shows you can handle debt and grow your business.
Smart business owners check and recalculate their construction profit margin every quarter. This helps them adjust pricing and operations before problems arise.
2. Cash flow
Cash flow is the lifeblood of any construction operation. It tracks money moving in and out of your business during specific time periods. Your profit figures might look great on paper, but cash flow shows if you can actually pay bills, fund projects, and run operations smoothly.
Many seemingly profitable construction businesses fail because they don't manage their cash flow well. Having profit doesn't mean you'll have money when you need it most. The construction industry's profit margins usually sit around 3-4%, which makes tracking your cash position even more significant.
Net cash flow vs. projected cash flow
Net cash flow gives you a snapshot of your current financial position by measuring the difference between money entering and leaving your business. The formula is simple:
Net Cash Flow = Total Cash Inflows - Total Cash Outflows
Let's look at an example: if your construction company brings in $500,000 while spending $300,000, your net cash flow equals $200,000, putting you in a positive position. A positive cash flow shows financial health, while negative cash flow warns of trouble ahead.
Projected cash flow looks to the future. This forecast helps you see your financial position in the weeks, months, or quarters ahead. Construction cash flow forecasting combines accounting data with project management information to predict future money movements.
Projected cash flow involves:
- Identifying all incoming funds (client payments, loans, grants)
- Outlining expected costs (payroll, materials, equipment)
- Aligning expenses with your project timeline
- Spotting periods where cash might be tight
The distinction matters, net cash flow shows where you are today, while projected cash flow helps you get ready for tomorrow. These metrics work together to keep your finances stable throughout project lifecycles.
How to use cash flow to plan ahead
Your cash flow projections act as a financial early warning system. Looking 3-6 months ahead helps you spot potential cash problems before they happen so you can take action.
Start by setting a realistic timeframe. Most construction companies that are 5+ years old do monthly forecasts, though weekly projections give more control in uncertain times. Quarterly forecasts work well for businesses with steady cash cycles.
Regular comparison between projections and actual results reveals trends and unusual patterns that explain your financial performance. This analysis shows seasonal patterns, project challenges, and ways to streamline processes.
Cash flow forecasting lets you plan big equipment purchases, expand markets, or handle slow periods. Evidence-based insights will guide your strategy instead of gut feelings.
Good cash flow management helps you:
- Plan project timelines that match available funding
- Keep subcontractors happy with timely payments
- Avoid extra loans and fees
- Make smart decisions about new projects
Construction businesses running multiple projects at once need cash flow projections. Each project needs upfront money while payments often come after work is done. Without proper forecasting, you might run short of capital at critical moments.
Creating multiple scenarios, best-case, worst-case, and most-likely, helps you understand risks and opportunities better. This approach prepares your company for whatever comes next, making it financially stronger.
3. Working capital
Working capital represents your construction business's operational capacity in dollar terms. This financial KPI tells you if your business can fund operations, handle new projects, and deal with surprises. Let's explore how to calculate this metric and understand what these numbers mean for your construction business.
Formula and interpretation
The working capital calculation is straightforward:
Working Capital = Current Assets – Current Liabilities
Current assets are your cash, accounts receivable, inventory, and anything else you can convert to cash within a year. Current liabilities include accounts payable, short-term debts, and obligations due within 12 months.
Your construction company has $70,000 of working capital if it has $100,000 in current assets and $30,000 in current liabilities. This means you have $70,000 ready to use in the short term.
Adjusted Working Capital is a crucial concept in construction. Creditors and bonding companies reduce working capital by excluding certain current assets they see as non-liquid or unreliable. These assets often include:
- Inventory
- Prepaid expenses
- Related party receivables
- Past due receivables
Creditors might fully or partially exclude these items based on their standards.
Your company's working capital directly affects the backlog you can safely manage. Industry experts recommend multiplying your working capital by 10 for most small to medium-sized trade contractors. Larger companies and general contractors who subcontract most work can aim higher.
Here's a real-world example: A small trade contractor with $500,000 working capital using a multiple of 10 can target a $5 million backlog (Working Capital × Multiple = Target Backlog). The target annual volume would reach $20 million if jobs typically last three months, meaning four turnovers yearly.
What negative working capital signals
Negative working capital happens when current liabilities exceed current assets. The construction industry's interpretation isn't always clear-cut.
Companies with negative working capital often lack resources to pay short-term debts. This situation might push you toward additional borrowing or delayed vendor payments.
Construction businesses face a big risk with inadequate working capital. Growth represents substantial risk since construction businesses often struggle with working capital shortages. Few contractors create advance cash flow plans or base their go/no-go decisions on their ability to finance extra work.
Extended periods of negative working capital might indicate:
- Cash flow problems affecting project execution
- Backlog exceeding financial capacity
- Collection issues with accounts receivable
- Problems paying suppliers and subcontractors promptly
The construction industry's financial foundation requires sophisticated planning for effective working capital management. A solid plan must factor in your progress payment collection history, supplier relationships, adequate credit lines, and smart use of retained earnings.
Working capital needs monthly monitoring as a crucial financial KPI. Regular assessment of how specific transactions affect it helps maintain financial health.
4. Cost performance index (CPI)
Budget performance measurement in construction needs more than gut feelings, it needs precise Cost Performance Index tracking. CPI stands out as a key financial metric for construction companies. This metric shows exactly how much completed work you get for every dollar spent.
Understanding earned value
Earned value management (EVM) are the foundations of CPI. The system combines three key components:
- Planned Value (PV): The budgeted cost of work scheduled to be completed by a specific date
- Earned Value (EV): The value of work actually completed (calculated as percentage of work completed × total budget)
- Actual Cost (AC): The real money spent on the project up to the measurement point
Your earned value calculation comes from multiplying completion percentage by total project budget. To cite an instance, a $100,000 project that's 40% complete has an earned value of $40,000.
Earned value analysis blends schedule, scope, and cost to give a complete picture of project performance at any time. You get clear answers to vital questions like:
- Is your project on schedule?
- Is your project on budget?
- How much more money will you need?
- What will the final cost be?
What CPI tells you about budget use
The Cost Performance Index formula is simple:
CPI = Earned Value (EV) / Actual Cost (AC)
This ratio quickly tells you your project's budget status:
- CPI > 1: Your project is under budget and running efficiently
- CPI = 1: Your project matches the budget exactly
- CPI < 1: Your project exceeds budget and spends inefficiently
Here's a real example: Your construction project has earned $180,000 (40% of your $450,000 budget), but you've spent $200,000. Your CPI calculation would be: $180,000 ÷ $200,000 = 0.90
A CPI of 0.90 means you get only 90 cents of value per dollar spent, showing you're trending over budget.
CPI works as more than a budget tracker. It spots cost overruns before they become major issues and lets you take corrective action quickly. Project managers can move from reactive problem-solving to strategic planning with this tool.
CPI is a great way to get intelligence for resource allocation, especially for construction firms managing multiple projects with slim profit margins. You can predict future cost trends and adjust proactively by monitoring this metric regularly, whether you need to move resources, adjust timelines, or refine scope.
Complex financial dynamics become a simple, applicable ratio that shows your value delivery per invested dollar. Projects often exceed budgets in this industry, so this clarity helps you make smart decisions before small inefficiencies eat away your profit margin.
Construction companies should check their CPI values regularly to spot schedule changes and cost overruns. Your CPI values should stay within one standard deviation of expected projections. You should break down potential calculation errors, data issues, or major project risks if your CPI falls outside this range.
5. Schedule performance index (SPI)
Time is money in construction projects. Each day that passes can eat into your profits. Schedule Performance Index (SPI) gives you a mathematical way to answer a simple question: "Are we on schedule?" This metric shows how well you're sticking to your timeline and measures your schedule efficiency objectively.
How SPI tracks project timelines
SPI uses a simple calculation that turns gut feelings about schedules into hard numbers:
SPI = Earned Value (EV) ÷ Planned Value (PV)
Where:
- Earned Value shows the budgeted value of completed work
- Planned Value shows the budgeted value of work you should have completed
Your SPI number tells a clear story:
- SPI > 1: You're moving faster than planned
- SPI = 1: You've hit the schedule perfectly
- SPI < 1: You're lagging behind schedule
Here's a real example: Your project should have completed $1,000,000 worth of work by today. You've only finished $850,000 worth. Your SPI calculation looks like this:
$850,000 ÷ $1,000,000 = 0.85
An SPI of 0.85 means you've completed just 85% of planned work. You're falling behind.
Using SPI to avoid delays
SPI shines because it catches problems early. Traditional schedule tracking often spots issues too late. SPI helps you fix small schedule problems before they become big headaches.
You should check your SPI:
- After finishing major project phases
- During regular reporting cycles
- When big schedule changes happen
Your SPI drops below 0.90? Time to act. You can:
- Move resources from less urgent work to critical tasks
- Reset task priorities to focus on what matters most
- Add more hours or bring in extra help
- Find and fix workflow bottlenecks
SPI tracking across multiple projects reveals valuable patterns. If several projects show declining SPI, you might have deeper issues with estimates, resources, or processes that need your attention.
SPI works best when paired with Cost Performance Index (CPI). They paint a full picture of project health together. A project might save money but run late - that's not good for client relationships or long-term success.
Construction businesses run on slim margins. Keeping your SPI at 1.0 or higher protects more than client satisfaction - it guards your profits. Delays increase overhead costs, might trigger penalties, and hold up your final payments.
6. Accounts receivable turnover
Accounts receivable turnover shows how fast your construction business gets paid by clients. Construction contractors typically provide services before receiving payment, and this financial KPI helps you learn about your collection efficiency and cash management.
Why slow payments hurt cash flow
Payment delays create major headaches in construction these days. About 82% of contractors wait more than 30 days to get paid, compared to 49% just two years ago. These delays send shockwaves through your business operations.
Your business becomes an unofficial bank when clients pay late. You still need money to cover payroll, materials, and subcontractor costs. The gap between money going out and coming in puts enormous strain on your working capital.
The financial toll is staggering. Payment delays cost the industry about $280 billion [link_2] in 2024. Individual companies face these challenges:
- Project schedules get disrupted when you can't buy materials or keep workers
- Credit line interest piles up as you cover cash shortfalls
- New opportunities slip away while your capital stays locked up
- Delayed payments lose value due to inflation
Small subcontractors feel the squeeze hardest, 43% lack enough working capital to handle unexpected costs or delays.
How to improve AR turnover
You need an all-encompassing approach to boost your accounts receivable turnover:
1. Establish clear payment terms. Your contracts should spell out payment schedules with firm due dates and late payment penalties. About 76% of contractors offer early payment discounts to get paid faster. This strategy could work for you too.
2. Implement progress billing. Bill clients at project milestones rather than waiting until the end. This creates steady cash flow during long projects and reduces financial pressure.
3. Review client creditworthiness. Run credit checks before starting new projects to see payment track records and financial health. This helps you avoid slow-paying clients and keeps your cash flow steady.
4. Automate your invoicing. Construction-specific software creates professional invoices right after project completion. These systems track pending payments and send reminders automatically.
5. Offer multiple payment options. Digital payments and online portals make it easy for clients to pay quickly, 82% of contractors would use digital payment systems to speed up their cash flow.
A high accounts receivable turnover ratio means you quickly convert unpaid bills into cash, which gives you more financial flexibility. Tracking and improving this KPI will strengthen your cash position and make your construction business more resilient.
7. Revenue per hour worked
Revenue per hour tracking is a great way to get insights about your construction team's productivity. This simple but powerful KPI shows real data about which activities, teams, and projects bring in the most revenue compared to labor costs.
Measuring labor efficiency
Labor costs make up between 40-60% of total project costs in most construction operations. Your profits can quickly disappear without proper tracking of this major expense. Revenue per hour shows the exact financial value generated from each hour of paid labor.
You can calculate this metric by dividing your total revenue by the number of hours worked during that period:
Revenue per Hour = Total Revenue ÷ Total Hours Worked
Precise time tracking determines how accurate this calculation will be. The American Payroll Association discovered that employees round up their time by an average of 42 minutes daily on timecards. A single worker earning $18/hour costs the company $16.31 each day through this padding - that adds up to $4,305.84 per year.
Smart device-compatible digital time-tracking systems now allow job site labor tracking in real time. Some advanced systems can collect data from RFID chips, which eliminates manual entry errors.
How this KPI helps with staffing decisions
Clear revenue per hour data shows which activities give the best financial returns. This information turns staffing into a data-driven process instead of guesswork.
Different project types can be compared to see which work categories should get priority in business development. Team productivity improves when you analyze performance by crew configuration.
This metric answers these significant questions:
- Which foremen or crews show the highest productivity and utilization rates?
- Do some teams have too much or too little work?
- Will hiring skilled workers for specific tasks save money?
Revenue per hour data makes your estimates more accurate. Historical productivity rates help predict labor needs for future bids. This prevents understaffing that delays projects and overstaffing that wastes resources.
The construction industry faces ongoing labor shortages. Each worker's productivity matters more than ever. Revenue per hour tracking identifies where training, workflow improvements, and technology investments will give the best returns on your labor investment.
8. Equipment downtime
Construction companies lose millions each year due to equipment failures, yet they don't deal very well with tracking this significant financial KPI. Construction equipment typically stays idle 20-30% of the time. This represents a huge drain on project profits that needs close monitoring.
Tracking lost hours
Companies must document non-operational periods systematically to calculate equipment downtime. Traditional methods like whiteboards or spreadsheets often led to delayed or wrong data. Modern digital solutions show up-to-the-minute equipment status. Managers can spot patterns and fix recurring problems quickly.
Lost hours tell only part of the story - their true cost matters more. A shocking 80% of companies can't figure out their actual downtime costs. Many experts suggest tracking how often equipment breaks down instead of just focusing on duration. This helps measure reliability better.
How downtime affects project costs
Equipment downtime costs go way beyond simple repairs. Lancaster Development's equipment manager Dan Corbett calls this the "collateral damage" effect. He notes that "It's not so much the repair of a downed piece of equipment, but how that affects the job".
This collateral damage has these effects:
- Workers sit idle when they can't work
- Emergency equipment rentals cost $80+ per hour
- Projects get delayed with possible penalty fees
A company with 50 pieces of equipment facing typical downtime could lose nearly $2 million yearly. Leading companies cut unplanned downtime from industry averages to about 5%. They do this through regular maintenance and special tracking software, which protects schedules and profits.
Conclusion
Financial KPIs turn abstract numbers into practical tools that boost construction companies' success. These eight metrics together paint a complete picture of your business health beyond traditional financial statements. You can spot problems early by monitoring these indicators before they become major challenges.
Net profit margin reveals your actual earnings. Cash flow tracking ensures timely bill payments and project funding. Working capital indicates your resource adequacy for current obligations. Cost and schedule performance indices provide live feedback on project execution. Your payment collection efficiency shows up in accounts receivable turnover. Revenue per hour worked shows your team's productivity, while equipment downtime tracking spots costly operational waste.
These metrics yield the best results when you review them regularly. A dashboard that shows your key KPIs helps you quickly. This approach makes financial monitoring a daily task rather than a quarterly burden.
Data alone won't improve your business. You need to take specific actions after spotting trends or issues through your KPIs. Smart adjustments based on accurate data often boost profitability substantially.
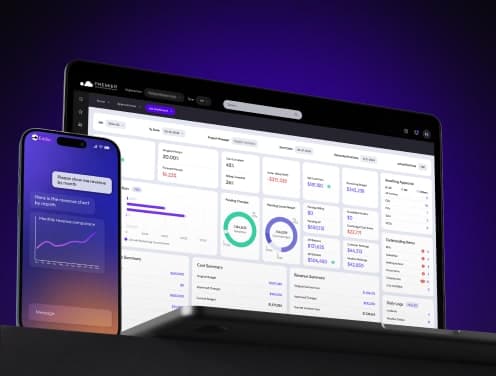
Construction financial management software like Premier Construction Software makes it much easier to monitor and act on your key financial KPIs in real time. By bringing accounting, job costing, project management, and field data into a single cloud-based ERP platform, Premier Construction Software gives contractors a live view of metrics such as job profitability, cash flow, WIP, and overhead allocation across every project. Automated workflows for billing, AP/AR, and inter-company transactions further reduce manual errors, so your KPI dashboards stay accurate and up to date, helping leadership make faster, data-driven decisions.
Construction companies operate on thin margins, and these financial indicators help make smart decisions about project selection, resource allocation, and improvement priorities. Your business needs more than guesswork - it needs the clarity that comes from tracking the right numbers at the right moment.
Latest articles


Trusted by global leaders
Join those who have put their trust in us