What to Include in a Construction Project Dashboard: Metrics, Reports, and Examples
Last updated: September 2026
Your construction project management dashboard should do more than display numbers. It should help you spot problems before they spiral. A construction project management dashboard is a visual display that brings your project's KPIs together on one screen. Most construction project dashboards concentrate on delivery and cost while tracking site performance. Budget variance, for example, should stay within 5 to 10% of budget. Safety incidents need tracking too, and that's one metric nobody wants trending upward. This piece walks you through the metrics, reports and construction project management dashboard examples you need to keep projects on track.
What is a Construction Project Dashboard
Definition and Purpose
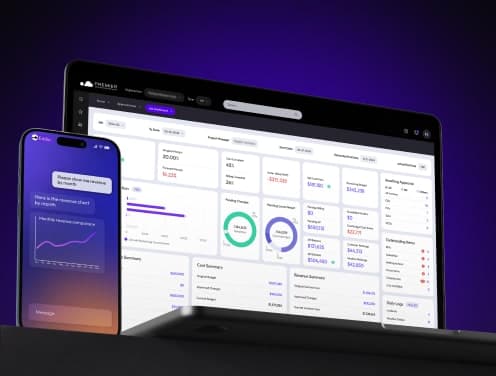
Construction data lives everywhere. Progress updates sit with your site team, costs hide in finance spreadsheets, and safety records collect dust in HSE files. A construction project management dashboard pulls all that scattered information into one centralized digital tool.
Think of a construction project management dashboard as your project's control tower. It gives you a clear view of every moving piece so you can make confident decisions without chasing down site reports. The dashboard unites critical project data into a single platform and eliminates the need for manual tracking that eats time and invites errors.
The main role centers on providing a visual overview of project metrics, status and performance. You get timelines, budgets and resource allocations displayed in charts, gages and trend lines. This visual representation makes it easier for you and other stakeholders to monitor progress and spot issues before they become expensive problems.
Construction project dashboards pull in live data to deliver up-to-date insights, unlike spreadsheets or static reports that require manual updates and provide only a snapshot in time. The project has moved on by the time someone resolves scattered data into a monthly report. You can monitor project status as it happens through immediate data visualization that presents live data in a clear, visual format and eliminates guesswork.
The dashboard also improves decision-making speed. You can act quickly to address emerging issues like cost overruns or resource shortages when you identify them, which reduces the risk of larger problems down the line. This accessibility encourages better communication among team members, contractors and project owners.
Key Components of Construction Project Dashboards
Every effective construction project management dashboard has specific elements that turn raw data into applicable decisions. Key Performance Indicators (KPIs) are the foundations and show how well your project performs against goals. These core metrics vary by project but typically have task completion rate, budget versus actual cost, schedule adherence and resource utilization.
Data visualization charts make complex information easier to understand at a glance. Bar and pie charts display task status or resource allocation, while Gantt charts show project timelines and dependencies. Progress curves plot planned versus actual completion over time and let you see whether your project runs ahead, on track or falls behind baseline.
Comparisons and trends add context to current data. You need to see planned versus actual timelines or costs, performance over weeks or sprints and historical trends in risk or workload. Budget variance means more when it sits next to completion percentage and change order frequency, because together they tell you whether an overrun represents waste or scope.
The dashboard should also track your project timeline through Gantt charts or milestones and display the schedule, critical deadlines and key milestones. Task progress and completion rates show what's completed, in progress or delayed. Budget versus actual costs compare planned spending with expenses in real time to prevent overruns.
Resource allocation and workload displays help you monitor how team members and resources distribute across tasks. Risk and issue tracking identifies potential bottlenecks and unresolved problems. Key deliverables and deadlines highlight major project outputs and their due dates.
Filters and drill-down features make construction project dashboards more powerful. Filters let you sort by team member, department, task type or time period. Drill-downs allow you to click into metrics and explore more detailed data. Role-based dashboards customize data access for different functions so each team member sees information most relevant to their role.
Mobile accessibility keeps field crews and project managers connected with updates in real time on-site, just like office staff. Integration with core construction systems eliminates inefficiencies and syncs with tools you already use.
Essential Metrics to Track in Your Construction Dashboard
The right metrics separate dashboards that drive decisions from ones that collect dust. You don't need every possible data point. You need the ones that tell you whether your project stays on track or heads toward trouble.
Project Completion and Schedule Metrics
Schedule slippage costs money fast. Delays trigger penalty clauses and drive up labor costs. They strain client relationships. Your construction project management dashboard needs metrics that catch timeline problems early.
Schedule Performance Index (SPI) compares actual progress against planned progress. An SPI below 1.0 means you're behind schedule. If your SPI hits 0.85, you've completed only 85% of the work you should have finished by now. Percent Plan Complete (PPC) measures how many weekly commitments your teams and subcontractors meet. Top-performing builders target a PPC above 95%.
Milestone completion tracking matters because critical phases need to finish on time for subsequent work to start. Framing must complete before electricians can run wires. Progress tracking through planned versus actual curves helps you spot deviations from your schedule early. This allows you to take corrective actions on time.
Interactive Gantt charts give you a visual timeline that shows task dependencies and overlaps. The critical path identifies the longest chain of related tasks. Any delay on this path delays your entire project by the same amount.
Budget and Cost Control Metrics
Cost overruns hit 85% of construction projects. If that statistic doesn't get your attention, your profit margin will. Budget tracking isn't optional when margins run this tight.
Cost Performance Index (CPI) measures the ratio of earned value to actual costs. A CPI above 1.0 means you're under budget. Below 1.0 signals overspending. Budget variance exceeding 5% serves as a red flag that requires immediate attention. Some projects keep variance within 2-5% of budget.
Job cost variance shows the difference between estimated and actual costs. Watching this with up-to-the-minute data beats hoping your estimates were right. Track actual costs versus forecasts on a regular basis, since estimated construction costs can vary by a lot due to project specifics like shifting weather conditions.
Gross profit margin by job reveals which projects make money and which ones eat your lunch. That big commercial job might run at 8% margin while smaller remodels pull 25%. Forecasted Final Cost (FFC) estimates total project expenses by combining current costs with future projections. It accounts for subcontractor changes and potential risks.
Labor and Resource Utilization Metrics
Labor represents your biggest controllable expense. Workforce scheduling becomes critical for profit margins. Labor productivity measures output per labor hour, with high-performing teams targeting a 4% improvement each week.
Equipment utilization rate tracks how often machinery generates revenue versus sitting idle. A rate above 80% is excellent. Idle equipment adds costs through rentals and depreciation that you don't need. Resource allocation helps identify underperforming teams or resource gaps in your project portfolio.
Workforce productivity compares work completed to labor hours. This gives you insight into both project estimation and labor efficiency. Planned versus actual hours shows whether your estimates were accurate at the start and whether crews work efficiently or face productivity challenges.
Safety and Compliance Metrics
A single safety incident can delay your project, trigger financial penalties, and harm workers. Safety incident rates measure the number of incidents per 100 full-time workers. Total Recordable Incident Rate (TRIR), Days Away Restricted or Transferred (DART), and Lost Time Injury Frequency Rate (LTIFR) are the foundations of safety tracking.
Regulatory compliance monitoring helps you adhere to OSHA standards and avoid legal penalties. Leading indicators like training completion rates and hazard reports predict future incidents. Near-miss volume does the same. You can reduce incidents by 77% when you connect leading and lagging safety indicators in a systematic way.
Quality and Change Management Metrics
Rework costs 2 to 6% of total project value. Large projects see defect-related rework reach up to 9% of total costs. These are preventable expenses that kill margins.
First-time quality rate measures the percentage of installed work that passes inspection without correction. Rework rates track the percentage of work that requires redoing due to errors or poor quality. Time between opening and closure of non-conformance reports (NCRs) indicates how quickly you address quality issues.
Change order frequency monitors how often scope changes occur during a project. High frequency indicates planning gaps or poor communication. It can also signal project instability that leads to increased costs and delays.
Critical Reports Every Construction Dashboard Should Include
Reports change scattered metrics into decisions. You can track schedule variance and budget burn all day, but you're still guessing without structured reports that blend that information. Construction project dashboards need three report types that turn data into action.
Real-Time Progress Reports
Large construction projects run 20% behind schedule on average and can go as much as 80% over budget. 98% of projects face delays in North America, with average durations stretching 37% longer than originally projected. Real-time progress reports help you catch these deviations before they become catastrophic.
These reports compress the gap between event and response and prevent small issues from escalating into expensive problems. Information ages by the time it reaches decision-makers when you rely on weekly site walks and manual updates. Real-time data gives teams instant visibility into site conditions, progress, safety and coordination issues.
Work-in-Progress (WIP) reports provide detailed overviews of ongoing tasks and activities within your project. They track project phases, budget utilization, resource allocation and completed versus remaining work. Construction projects can last months or years, so you cannot wait until the very end to find out if a project was profitable. WIP reports let you figure out whether you're on track to make those profits while there's still time to correct course.
Progress documentation linked to your live schedule creates the most value directly. Images and site notes that aren't mapped to specific schedule tasks have limited use for progress tracking. Integrating capture workflows with software that links images to Gantt charts and work breakdown structures turns documentation into insights you can act on.
Timestamped visual records hold credibility in disputes. Every data point captured in real-time becomes defensible evidence potentially. Verified progress records answer the question quickly when owners request payment validation. You can refer to a time-stamped visual record of what was built and when disputes arise.
Financial Performance Reports
Financial statements aren't just for accountants. They're operational tools that tell you whether individual projects and your overall firm remain stable financially.
Income statements detail revenue and expenses and show profitability during a specific period. They break down direct costs related to construction contracts and indirect costs like overhead. The final figure, net income, represents your profitability and serves as a key metric for investors and management to assess financial health.
Balance sheets offer snapshots of your company's financial condition at specific points in time. They include assets, liabilities and equity. Current assets include cash, accounts receivable and retainage receivable, which are payments withheld on construction contracts until certain conditions are met.
Cash flow statements track the flow of cash within your company, categorized into operations, investing and financing activities. This statement matters for monitoring liquidity, with sections highlighting cash flows from operating activities like changes in accounts payable and receivable. Construction companies often deal with delayed payments and need a clear picture of actual cash flow to manage finances smoothly.
Construction cost management reports track, analyze and control project financials throughout the construction lifecycle. They focus on documenting budgeted versus actual costs, forecasting future expenses, managing changes and monitoring cash flow. They help identify cost overruns early when used effectively, arrange spending with project objectives and contribute to overall financial health.
Risk and Issue Tracking Reports
The Construction Industry Institute says there are about 107 construction risks you should think about when managing a project. You find yourself relying on those who manage the risks to report on them without proper risk assessment and control, creating a cycle of delays and rework.
Risk tracking reports help you address problems early. They document identified risks, probability of occurrence, potential risks and mitigation strategies. Good reports let you spot patterns. That signals a systemic vendor issue if material delivery delays keep appearing across jobs.
Construction incident reports are formal documents detailing accidents, injuries, near misses or unexpected events occurring on your site. These reports provide clear records of circumstances surrounding incidents. Incident reports enable you to analyze root causes and implement preventative measures by documenting key details such as time, location, individuals involved and corrective actions taken.
Manual report processes leave room for delays and error and risk your project timeline and budget greatly. You must wait until you're back in the office to record what you saw if you're out on the field and notice damaged electrical wiring in a paper-based system. This could delay information for hours or even days, and you risk recording misremembered or outdated information.

Key Features of Effective Construction Project Dashboards
Features make or break adoption. You can load a construction project management dashboard with every metric imaginable, but if your site supervisors can't access it from their phones or your CFO can't customize views, you've built a data graveyard.
Real-Time Data Integration
Field conditions change constantly. Waiting until tomorrow's report to find out costs you money. Real-time construction data gives teams instant visibility into site conditions, progress, safety and coordination issues. This immediacy reduces delays, rework and disputes by shortening the time gap between issue detection and response.
The biggest sources of real-time data include IoT sensors, mobile reporting apps, 360° site capture, BIM integrations and Reality Intelligence platforms. Mobile field reporting platforms like Raken, Fieldwire and Procore Field Reports guide site supervisors through structured daily reports that are timestamped at submission, weather-logged and synced to a central project record automatically.
Integrated data provides a single version of the truth across field, office and design teams. Companies improve data quality and decision-making through centralized platforms. Data flows naturally across systems, including real-time data from IoT devices. Construction leaders can evaluate project health and analyze risks instantly.
Business intelligence tools like Tableau or Power BI provide the analysis layer and allow teams across multiple departments to visualize insights and make evidence-based decisions. These tools support interactive dashboards, ad-hoc reporting and trend analysis. Executives, project managers and field staff can explore data in real time.
Customizable Views and Layouts
Executives need portfolio-level overviews. Project managers need task-level details. Field workers need daily logs. One generic view satisfies nobody and confuses everybody.
Role-based dashboards customize data access for different functions. Field staff view only the projects they're involved in. Managers restrict sensitive financial details like payroll and profit margins to authorized individuals, and clients access progress updates and expense breakdowns. Dashboards support up to four columns, with widgets arranged in rows that you can drag, resize and reorganize.
User-Friendly Interface
An easy-to-use interface reduces the learning curve for new users and allows all team members to focus on their responsibilities instead of struggling with the tool itself. Features such as labeled sections, simplified navigation menus and customizable layouts enable users to locate critical data without unnecessary delays.
Drag-and-drop functionality, interactive charts and quick search tools cater to seasoned professionals accustomed to complex systems and those less familiar with digital tools. This accessibility encourages better collaboration, as all users can participate in project discussions and contribute meaningfully.
Mobile Accessibility
Field teams don't work from desks. They need dashboard access where the actual work happens. The best mobile dashboards offer the same capabilities as web versions: daily logs, GPS-enabled timecards, photo capture and markup, plan viewing and even in-person payment processing.
Communication gaps disappear and data accuracy improves with GPS clock-ins, photo attachments to punchlist items and real-time task updates from the field. Changes made on-site become visible in the office instantly.
Types of Construction Project Management Dashboard Examples
Different roles need different views. Your site superintendent doesn't care about portfolio-level cash flow, and your CFO doesn't need to see today's concrete pour schedule. Construction project management dashboard examples vary by who's looking at the screen and what decisions they need to make.
Executive Summary Dashboards
Executives manage multiple projects at once and need portfolio-level visibility without drowning in operational detail. A construction executive dashboard pulls cost, schedule, and progress data into one live view.
The typical executive view has project completion percentage, budget variance by cost code, safety incident trends and current cash position on one screen. This united view helps leadership spot patterns across projects. Three jobs in the same region show declining labor productivity for consecutive weeks? That signals a systemic problem worth investigating before it spreads to other sites.
Premier Construction Software provides construction ERP solutions that combine project data across your entire portfolio and give executives the high-level insights they need without manual report compilation.
Project Manager Operational Dashboards
Project managers run builds week to week. They need operational dashboards that answer four questions: Are we on schedule? Are we on budget? How is the site performing? Is the scope holding?
A typical construction project dashboard tracks eight KPIs grouped around those questions. Project completion percentage and schedule adherence compare work done against plan. Slippage shows up in weeks, not at handover. Budget variance and material cost per square meter track actual spend against estimate. Labor productivity, equipment utilization and safety incidents cover the crews and plant doing the work. Change order frequency counts revisions. A rising count explains budget variance before anyone has to go digging.
Financial Controller Dashboards
Financial controllers need detailed job cost tracking and cash flow visibility. Project financial overviews provide complete visibility into project performance. Dynamic job cost statements help track actual costs and forecast completion costs. The system provides continuous access to live work-in-progress details and removes the need for manual compilation.
Controllers also monitor budget performance, change orders and RFIs from their dashboards. This financial layer sits above individual project operations but below executive portfolio views.
Site Safety Dashboards
Safety dashboards track incidents, near misses, PPE compliance and inspections in one view. Key performance indicators include total incidents year-to-date, Lost Time Injury Frequency Rate (LTIFR), PPE compliance percentage, safety inspections completed, toolbox talk participation and corrective actions completed.
Live data from checklists and observations feeds into KPI and trend analysis. Workers submit observations with photos and videos captured in mobile apps. This immediate reporting reduces information lag and helps supervisors address issues before they escalate into serious incidents.
How to Build a Construction Project Dashboard
Building a construction project management dashboard doesn't require a computer science degree. The process follows six steps that turn scattered data into visual decision tools.
Identify Your Key Performance Indicators
Focus on metrics that connect to business outcomes and priorities. You don't need hundreds of measures. Construction companies should identify and track KPIs that provide valuable information for critical success factors rather than monitoring every possible data point.
Ask yourself what decisions you make weekly. Budget reallocation? Crew reassignment? Material ordering? Your KPIs should answer those questions. Schedule adherence and labor productivity matter more than enterprise-wide cash flow if you're a project manager. Job cost variance and forecasted final cost drive your decisions if you're a CFO.
Select the Right Dashboard Software
No-code and low-code tools like Power BI, Tableau, and Airtable handle growing data needs without requiring developers. Drag-and-drop builders let you create tools that fit your specific workflow without coding.
Some platforms include AI assistants that help you write formulas and build structure. Teams can create complex tracking tools without hiring developers. You can use Python formulas to handle custom calculations for advanced needs.
Connect Your Data Sources
Dashboard software supports connections to spreadsheets, databases, cloud platforms, and enterprise systems. Power BI connects to SQL Server, Excel, Oracle, and Azure databases along with dozens of other sources. Direct API connections pull data from platforms like construction accounting systems to feed immediate updates.
Design Your Dashboard Layout
Place critical metrics at the top for easy access. Use the right chart types for your data. Line charts show trends over time while pie charts display budget breakdowns. Drag-and-drop widgets let you arrange layouts tailored for different stakeholders. Custom templates can be reused across projects with the same structure available for different teams.
Set Up Automated Reporting
Automation minimizes manual measurement errors and saves time gathering metrics. Set up scheduled data refreshes and automated alerts when KPIs exceed thresholds. Recurring report generation eliminates the need to compile monthly reports manually.
Test and Refine Your Dashboard
User acceptance testing reveals how people use your dashboard. Start with moderated testing where you observe users exploring the dashboard. Then move to unmoderated testing where users provide feedback on their own time. Ask open-ended questions like "What did you expect to happen when you clicked that?" to understand their experience.

Construction Project Dashboard Examples and Templates
Templates give you starting points instead of blank screens. You can download ready-made construction project dashboards and adapt them to your specific workflow. This cuts weeks off your implementation timeline.
Small-Scale Residential Project Dashboard
Residential builds need straightforward tracking without enterprise complexity. A simple construction project dashboard template has a project task table with assignments, start and end dates, status, and priority designations. It also has graphs for the task timeline, budget, and pending items.
This setup works well for remodels, custom homes, and small commercial builds where your team size stays manageable. The template covers what matters: who's doing what, when it's due, and how much you're spending. You don't need advanced portfolio analytics when you're running two projects at once.
Large Infrastructure Project Dashboard
Infrastructure projects demand different visibility. A critical path dashboard template lists tasks by durations in days, categories, milestones, and statuses. It charts task categories from project planning and initiation to completion and closure. It helps you visualize task durations with a 100-day timeline.
Job costing dashboards for large projects track labor, materials, equipment, and subcontractor cost totals. They break down cost totals by hours, unit price, and budget percentages with a pie chart for easy reference. Risk dashboards add another layer. They detail project tasks, assignments, priority levels, and risk statuses. The corresponding timeline visualizes task start and end durations in days along with a risk status pie chart.
Multi-Project Portfolio Dashboard
Portfolio dashboards total data across multiple active projects. They feature complete project data tables with status, project completion percentage, risk level, and strategic objective columns. Bar charts show portfolio and individual project health, project status, and strategic objective breakdowns.
Best Practices for Using Construction Dashboards
Adoption beats sophistication every time. You can build the most complete construction project management dashboard, but if your team doesn't trust it or use it correctly, you've wasted everyone's time.
Set Clear Objectives and KPIs
Link KPIs to business objectives rather than tracking metrics because they seem important. Your dashboard should highlight schedule variance and cost performance if you're focused on reducing project overruns. Track milestone completion rates and change order response times if client satisfaction drives your strategy. Companies using business intelligence tools make decisions five times faster when metrics connect to clear goals.
Ensure Data Accuracy and Consistency
A dashboard only works if its data is reliable. Figures pulled straight from source systems beat manually entered data every time. You can't calculate cost variance when cost codes and project IDs don't match across your accounting and scheduling systems. Fix your data infrastructure before building fancy visualizations.
Train Your Team on Dashboard Usage
Train crews on what to do when a metric turns red. A slipping productivity indicator means nothing if nobody knows the next step. Show your team how to interpret performance metrics and take action.
Review and Update Regularly
Schedule performance reviews to discuss metrics and make adjustments. Your construction project dashboards have to evolve as needs change. Make dashboard reviews part of routine project discussions rather than something you do quarterly.
Conclusion
Construction dashboards turn scattered data into decisions you can act on right away. Pick the metrics that matter most to your role, connect your existing systems and start tracking what drives project outcomes. You don't need to build everything at once. Start with one dashboard focused on your biggest pain point, whether that's budget variance, schedule delays or safety incidents.
Premier Construction Software provides construction ERP solutions that integrate your project data across scheduling, costing and financial systems. This gives you up-to-the-minute visibility without manual report compilation.
Latest articles


Trusted by global leaders
Join those who have put their trust in us